Update 2: node2vec community detection with a co-occurrence graph
On node2vec, we were able to successfully run our weighted co-occurrence graph. After using PCA with TSNE to reduce the dimensions shown, the node2vec model has more well-defined clusters here than on our previous bipartite graph. Another thing to note is that on the right-side visualization, there are only people nodes. You can also check out our d3 visualization here, which allows you to zoom in/out and see the labeled nodes!
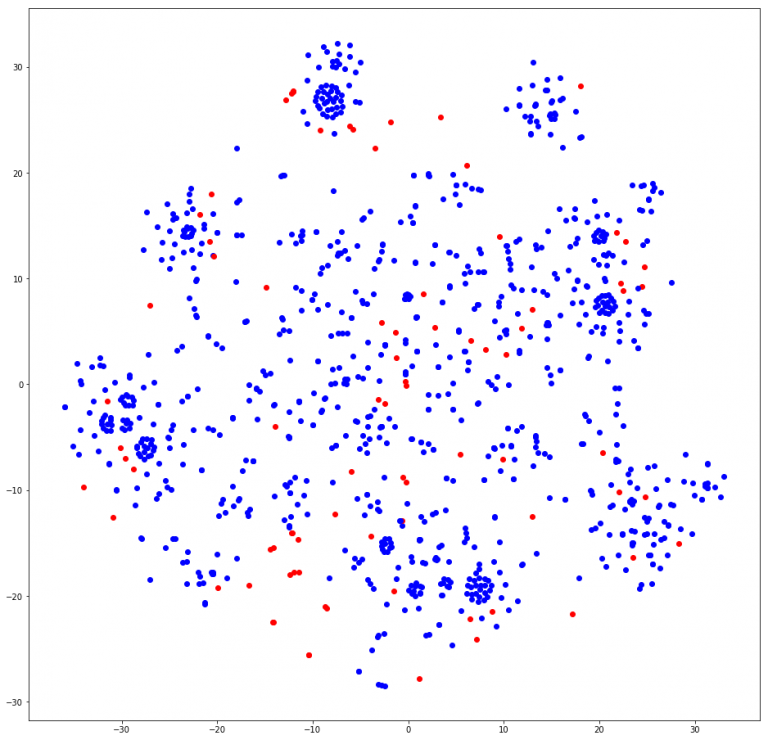
node2vec on our previous bipartite graph. The blue nodes are people while the red nodes are documents.
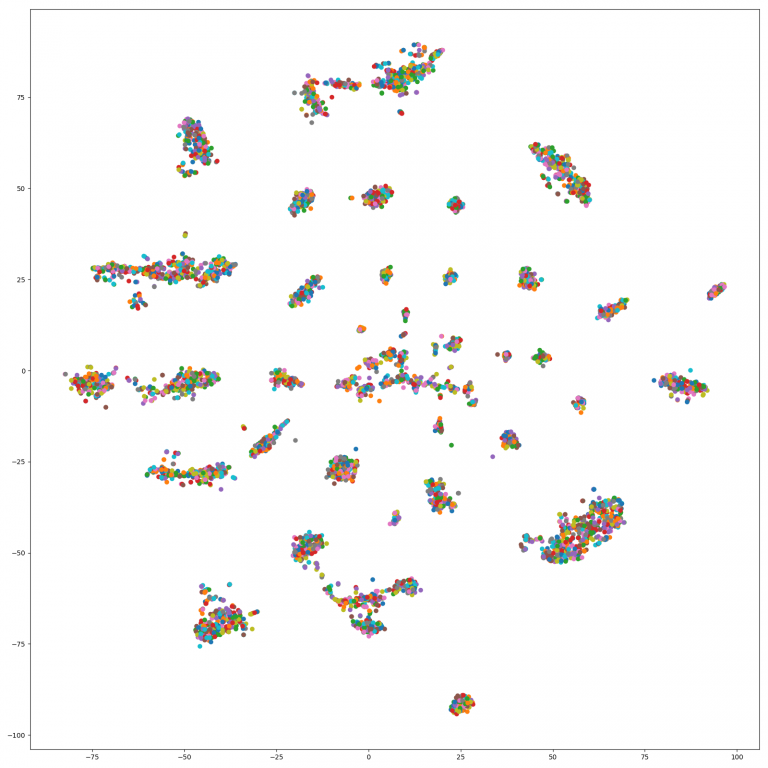
node2vec on our current graph. The colors are arbitrary.
Unlike Louvain, we can’t directly access these clusters by a certain index. Instead, we searched for people relevant to our research questions and used their names to find the most “similar” people closest to them according to the model. In particular, we looked for noted newspaper editors since our larger questions are about the transmission of ideas from the conventions to the newspapers. We’ll mention a few of these names here and show their results. Another note is that we also included various misspellings and abbreviations of the person’s name to see if there was a difference in grouping. :
- Mary Ann Shadd (later married as Cary), the first Black female newspaper editor (of the Provincial Freeman)
- Samuel Ringgold Ward – Shadd’s co-editor and former editor of the Colored American
- Charles B. Ray – another Colored American editor
- William Lloyd Garrison – the editor of Liberator (white abolitionist newspaper)
- Frederick Douglass – the famous and formerly enslaved author, abolitionist, and newspaper editor (multiple newspaper titles)
Initially, with node2vec on the bipartite graph, we were not only finding documents the nodes belonged in, but also variations of the same name in with the most_similar function. Additionally, the probabilities were no higher than 0.7 if there were different names. With the co-occurrence graph, however, the results give different people with probabilities near 1! For example, the model returned these top 10 names closely associated with Mary A. Shadd with these probabilities:
- G. W. Reed, 0.999171138
- Reese, 0.998797536
- Daniel Morgan, 0.998780012
- Henry Ray, 0.998680234
- Joseph Reeves, 0.99860239
- Benjamin B. Moore, 0.998560846
- Thomas Charnock, 0.998545408
- J. C. White, 0.998544097
- Edward M. Thomas, 0.998516679
- Jason Jeffries, 0.998452902
However, in further inspection with the original co-occurrence graph, all of these people are neighbors of Mary A. Shadd that belonged in the same document (Philadelphia, PA at 10/16/1855), hence the extremely high probabilities of similarity. Even with another query, Bibb, they also have slightly lower probabilities but still showed the same properties, although a few neighbors were in different documents with him.
- G. Weir (0.8813) : 1851.ON-09.11.TORO.txt
- Uriah W. R. Pelham (0.8671) : 1849.CT-09.12.NEWH.txt
- Charles Williams (0.8822): 1849.CT-09.12.NEWH.txt
… (others in same CT document) - J. Wilson (0.8893): 1851.ON-09.11.TORO.txt
- Payton Harris (0.8962): 1851.ON-09.11.TORO.txt
You can view the node2vec clusters here and view the code to get the associated documents here.
Some followup thoughts:
From our previous post, Louvain still had a majority of clusters by region or location, but there were a “large” minority of clusters that were quite national. How do those compare to the ones we found in node2vec? We sought out the clusters that each of the names belonged to in louvain, matched the topn parameter in most_similar to the size of the louvain cluster found, and compared how many people both clusters had in common. The average common percentage was around 62%, which means a good majority of the louvain clusters had some people in common with the associated node2vec “cluster”, but there were a few that differentiated how Louvain clustered groups versus node2vec.
For Shadd, we found that her Louvain and node2vc cluster only had 32% of people in common, which is quite low. In node2vec, we were able to find another significant leader, James McCune Smith in the node2vec cluster, but he was not in the Louvain cluster. Another keynote is that Louvain has a bias to cluster groups by the most edges, which node2vec tries to avoid by generating its walks with the p and q probabilities. We also saw Charles Ray in the same node2vec cluster, but not Louvain.
On the other end, William L. Garrison had 96% of people in common with a node2vec cluster, including one significant leader Phillip A. Bell. The only significant name not found in Louvain was Charles B. Ray. Checking with the original graph, it appears that his neighbors were in two documents in Philadelphia, PA in 1831 and 1832, which could indicate that this cluster was quite local. To check out all of this data, click here!
In conclusion, it appears that node2vec clusters people majorly based on neighbor-incidence, not necessarily the number of edges but how close a node is to another. However, we can manipulate how node2vec generate walks based off of the p and q parameters, which is responsible for the probability of moving forward/backwards on a path. Currently, I set p=1 and q=0.5 to mimic breadth-first search, but some put larger p’s to make it more depth-first search. In comparison to Louvain, Louvain seems to focus more on the number of edges rather than the path from one node to another.
That’s all for updates! Tune in soon for more to come 🙂
Amazing post!
Cheers from Brazil
Thank you.Very nice exposition. You do refer in your this post as well as previous posts github sites. Those don’t seem to be populated anymore. I would love to try your approach on another corpus and would appreciate if you can share your code.
Our code from this project can be found here: https://github.com/GeorgiaTechDHLab/abolition