Update: Detecting communities with a co-occurrence graph
From our previous post, we’ve discovered that the community detection algorithms were mainly grouping based on document/location. This time, we created a new weighted co-occurrence graph of all the people in all documents, similar to the Les Miserables example. The weight of an edge tells us the number documents the source and target nodes appeared in together. The graph itself has around the same amount of nodes (~5k) but it has 100 times more edges than nodes (~565k). There were many edges to render and process in a graph which might not be suitable for node2vec or Girvan-Newman.
Louvain, however, quickly detected 17 communities with a modularity of ~0.695, much higher than the bipartite network’s modularity (~0.511). Most of the clusters were nationwide, where the highest weights found were between 6 – 8 and the sizes were generally around 400 – 500 people nodes. Cluster 15 was the largest cluster found (521 nodes) where it had documents from almost every region of the US. The highest weight found was 6. Cluster 8 was the second largest cluster found (491 nodes) with a similar makeup, but the highest weight found was 8.
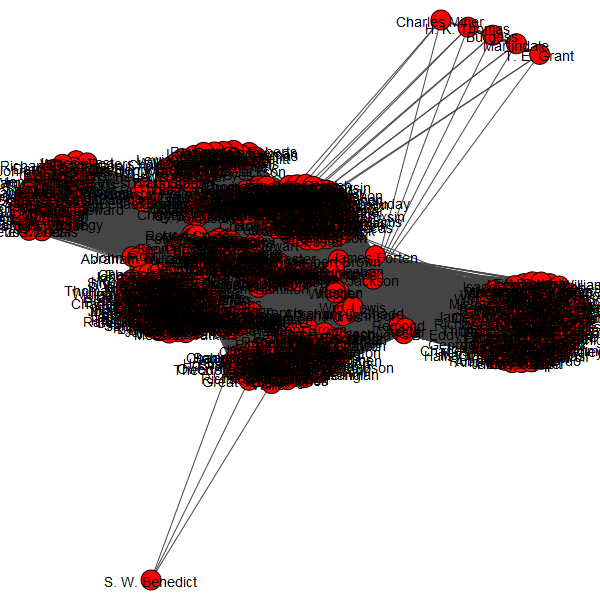
Cluster 15
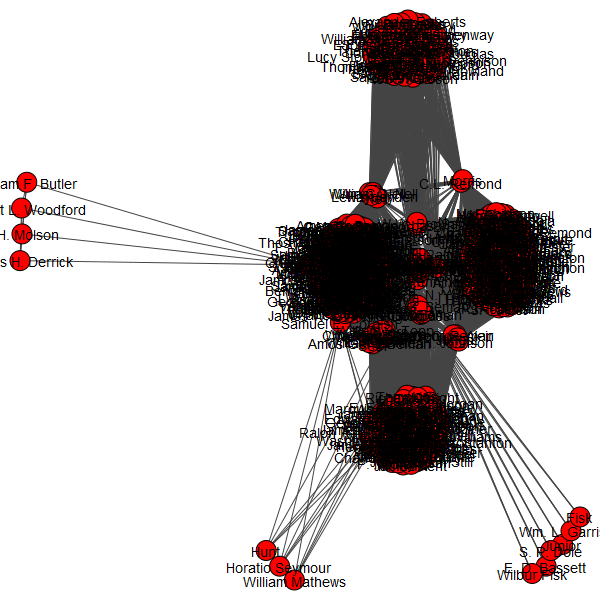
Cluster 8
6 out of the 17 communities had documents nationwide similar to clusters 15 and 8 with a size of around 430 – 500 nodes. Clusters less than that size become more regional or local to the document or the state from that document, especially if it mentioned a large number of people. For example, cluster 0 is focused on people from Tennessee and Kentucky, while cluster 2 focuses on the northeast. Cluster 4 focused on New York and Ontario, Canada. however, the direction of influence in clusters is unclear. Was it Canada that spread the message first? Or New York? Three other clusters based on the document alone were clusters 5 (New Hampshire CT), 14 (Nashville, TN), and 17 (Houston, TX). Unlike the first two, cluster 17’s highest weight found was 5, almost as big as the highest co-occurrence in nationwide clusters. Cluster 7 was based on a state alone, Iowa. An anomaly was cluster 3 that contained a single person, Lawrence Chaplin. However, Chaplin was the only person identified in the document for Portland, ME in 1850 with no other co-occurrences.
To see all the clusters and their properties, click here. To see all of the PNG files of each subgraph, click here. The code to use Louvain can be found here (Clustering with Louvain) and visualizing their clusters on d3 here.
A short analysis to make is that Louvain found large groups that were independent of a specific location. Around 30% of the clusters found were nationwide, which may mean that there are important leaders that helped spread the influence to the smaller regions and cities. The structure of the co-occurrence graph helped us reduce the bias towards clustering a specific document or the region of that document (although some of those clusters still existed). However, the problem with modularity still exists, where it has a bias to group clusters with more edges. This is evident within those 6 nationwide clusters and their higher weights (4 – 6). However, we still have to compare these results with Girvan-Newman and node2vec, which run quite slow.
Tune in soon to hear more updates with Girvan-Newman and node2vec!
[…] Post 4: Update I: Detecting Communities with a Co-occurrence Graph […]