Data by Design: Code Reuse and Visualizations
When I joined, the team had done a considerable amount of research, design, and requirements exploration in addition to our small prototype. One of the ideas continually emphasized was that the book would be heavily data-driven. This can be a bit of a buzzword and a swiss-army-knife of a term – the first two D’s in the popular web visualization tool D3 are “data-driven,” for a technical example, while data-driven can characterize approaches in other disciplines, like data journalism.
Data by Design is situated in a broad meaning of the category – we’re data-driven in the sense that the scope of the book is driven by contours in the history of data, and the research follows data and the people that wield it. But in addition to researching data and using data for research, we make our argument by presenting data, rendering it visually throughout the book. These include recreations of historical data visualizations and new takes on them: new visualizations of old data and historical visualizations swapped out with new data. So we’re also data-driven in the technical sense: the book is filled with interactive web components that render and depend upon collections of data.
That characterizes a common task throughout development: in every chapter, we need to build components that take some dataset and present it visually. Software engineering is all about abstraction and generalization—if there’s a repeated task, find a way not to repeat yourself—and while this might not sound like a lot of repetition (after all, there’s a big difference between the visualizations of Peabody and Playfair), from the development side, the visualizations have much in common. They each do all or many of the following:
- Require a data source to be loaded
- Reformat that data in some way
- Contain subcomponents that also need to see the data
- Respond to events (think of these as messages) from subcomponents and send events back out to the chapter
- Mutate the data (after user interaction)
- Allow the user to drag it into the notebook
- Save the mutated data to the notebook server when dragged into the notebook
- Show up in the chapter timeline
This adds up to a sizeable chunk of functionality that can be shared across visualization components so we don’t have to reimplement these features in every new visualization.
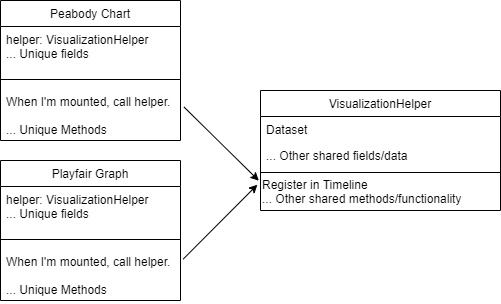
In object-oriented programming, there are two common ways of sharing groups of functionality among objects: composition and inheritance. With composition, the objects each have a copy of an object that does the desired functionality; with inheritance, the objects declare themselves as being a version of the object that does the desired functionality, and thus “inheriting” its functionality, thanks to language features like subclassing. In this example, if we use composition, the visualization components would each create an instance of some helper object that has the features implemented, and it would call the helper’s methods when necessary.
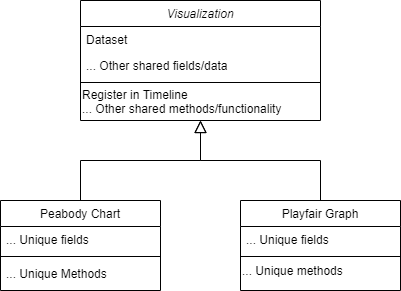
If we use inheritance, we’d declare each visualization component as being a Visualization, which would be thought of as a “parent” object, and then our visualization components would automatically contain all the functionality that was in the parent. (In many OOP languages these are called “superclasses,” or “abstract superclasses” when the parent is simply a template that depends on the child to flesh it out.)
Ever since the initial prototypes, Data by Design has used the JavaScript framework Vue.js. When I say “component,” I refer to the building blocks of a Vue application (somewhat analogous to “class” which is the building block of many OOP languages). I won’t go into all of the elements in a component, but they include:
- data, which are reactive properties that can be referenced and updated throughout the component and its UI. For example, the interactive Peabody grid uses a data field to keep track of and respond to the current pixel that the user is hovering over.
- props, which are like data, but they’re passed from the parent component to the child and can’t be changed by the child. That grid takes a “century” prop so it knows what year the first square of the grid represents.
- methods, pieces of functionality that it can call and reuse. The Peabody grid calls one of its methods every time the user hovers their mouse over it.
- lifecycle hooks, which set up the component to trigger pieces of functionality when something happens in the program. For example, a component might use the mounted lifecycle hook, which triggers when the component is added to the page, to register itself in the chapter timeline when it first becomes visible.
The newest release, Vue 3, ships with a Composition API to make it as easy as possible to share code across components using composition. OOP design patterns tend to favor composition over inheritance: composition can be easier to maintain, it avoids the rigid, predetermined taxonomy required by inheritance, it always allows for multiple helper objects (inheritance frowns upon multiple parent objects), and it even allows for techniques that swap out the helper object for another at runtime.
The Composition API brings a whole suite of code-sharing features to Vue that I’ve enjoyed using in newer projects, but most current Vue projects, Data by Design included, are built on Vue 2. A primary way to share functionality among components in Vue 2 is its mixin feature, which is similar to inheritance. Instead of building a “parent” object, you build a mixin object. This is written like any other Vue component and can have all the features that a component can, but it can’t be used directly. Instead, a component can declare that it is using that mixin (or any number of mixins), in which case all the data, methods, and hooks in the mixin are merged with (or “mixed into”) the component.
This lets us do something that composition often can’t: completely move functionality out of the way of the child components. When our team builds a new component, I don’t want us to have to think about registering it in the timeline or making it draggable or figuring out how to send data to subcomponents: if it isn’t unique to the component, I want it to be done automatically. With composition, you’d still have to explicitly configure the appropriate hooks, even if that configuration is a single call to a helper object. This is preferred in many applications: with composition, you can involve functionality as needed, without having to include things that aren’t. But in this case, aside from prioritizing an easy developer experience, we do want to enforce all of the functionality. In other words, we want to make sure that every Visualization does certain things and has certain capabilities. It’s a case where inheritance is indeed desired over composition.
The mixin is imported and added to a component using the mixins option in Vue:
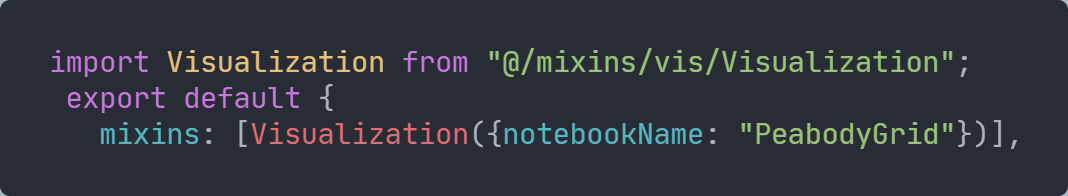
And then the visualization automatically gains all of the functionality in the mixin. Any props that that are specified in the Visualization mixin are now accepted by the child component, any data and methods created in the mixin are accessible, and its lifecycle hooks are registered.
So for the Visualization mixin:
- The props allow the component to take the name of a static dataset (which is to be grabbed from the server) and/or a mutable dataset (which is to later be sent to the server as part of the notebook). There’s also a width prop, which allows the component to base the size of visualizations on a maximum width that’s determined by the chapter.
- The hooks make sure that when the component is created, the specified datasets are downloaded or registered, and when the component is mounted (i.e., when it appears in the page) it creates a draggable icon in the corner for dragging the visualization into the notebook and lets the chapter timeline know.
- The data (really, computed properties) allow the child to view the dataset and various details about how it is registered.
- The various helper methods allow the component to transform the data, easily register events, and create lengths based off of the passed-in width.)
- Additionally, many of the properties and methods are set up to be injected further down the component tree. That means that they aren’t just accessible by the component that’s been directly “mixed” with the mixin; any component contained by it can request them.
Many of the Visualization mixin’s roles rely on its communication with various Vuex state modules. In other words, the Visualization mixin doesn’t keep track of all the visualizations and all the data itself; its job is to coordinate with those systems. I’ll talk about how these modules work in a future post, as this one’s getting long enough!
You can view the full code here.
[…] The div at index 1 in this example is the Map Scroller visualization. As I mentioned in my last post, visualizations all have a mounted hook that registers them when they get loaded into the […]