This project began with a simple idea: to digitally recreate some of the iconic charts of William Playfair, the eighteenth data visualization pioneer. Our premise was that, by remaking these charts, we’d come to see Playfair’s designs, as well as their underlying concepts, in a new light. By remaining equally attentive to the difficulties we encountered as we attempted to recreate the charts, we also hoped to learn about the conceptual assumptions that underlie visualization tools today.
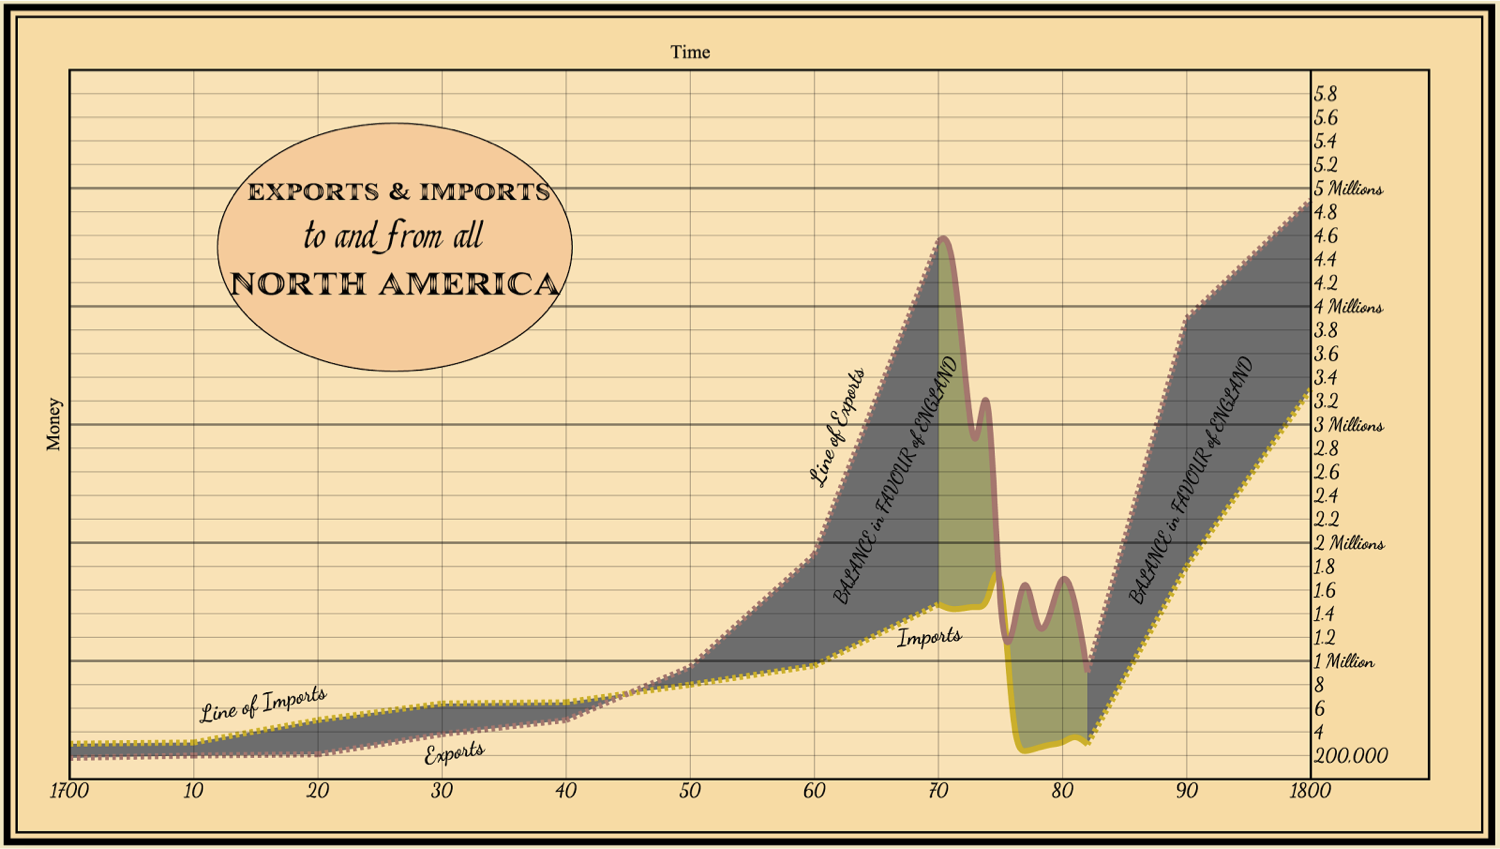
Static recreation of William Playfair’s “Exports and Imports to and from all North America” (1801). Image and implementation by Caroline Foster. Click here to explore.
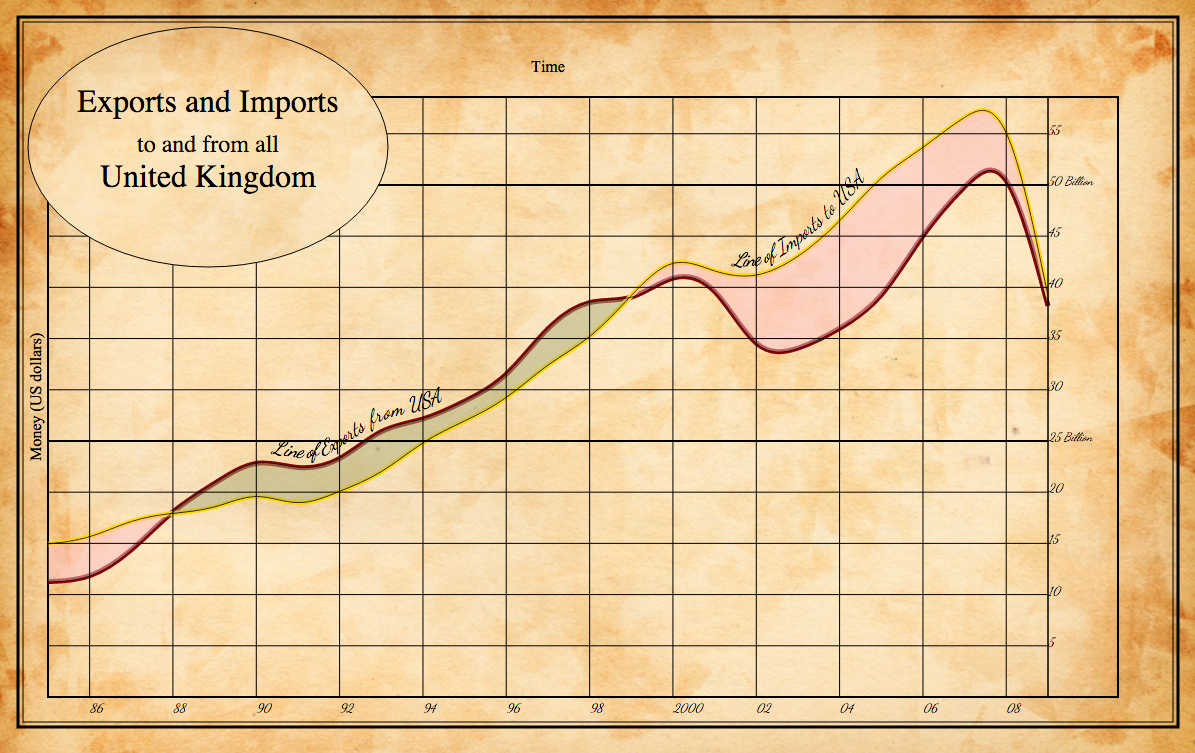
Interactive recreation of William Playfair’s “Imports to and from all North America” (1801). Image and implementation by Erica Pramer. Click here to explore.
Presentations and publications related to this project include:
- L. Klein, “Data, Image, and D3: Learning from William Playfair,” manuscript in preparation.
- L. Klein, C. Foster, and E. Pramer, “Data, Image, and D3: Repairing William Playfair” at the MLA Annual Convention, Austin, TX, January 2016.
- C. Foster, E. Pramer, and L. Klein, “Repairing William Playfair: Digital Fabrication, Design Theory, and the Long History of Data Visualization,” Digital Humanities 2016, Krakow, Poland, July 2016.
Project Contributors: Caroline Foster, Erica Pramer, and Lauren Klein.
You must be logged in to post a comment.