Designing on a Budget
When purchasing materials for the Peabody visualization quilt, we discovered that LEDs are expensive, and budget might be a limiting factor. Subsequently, we constructed our quilt’s physical design around this constraint.
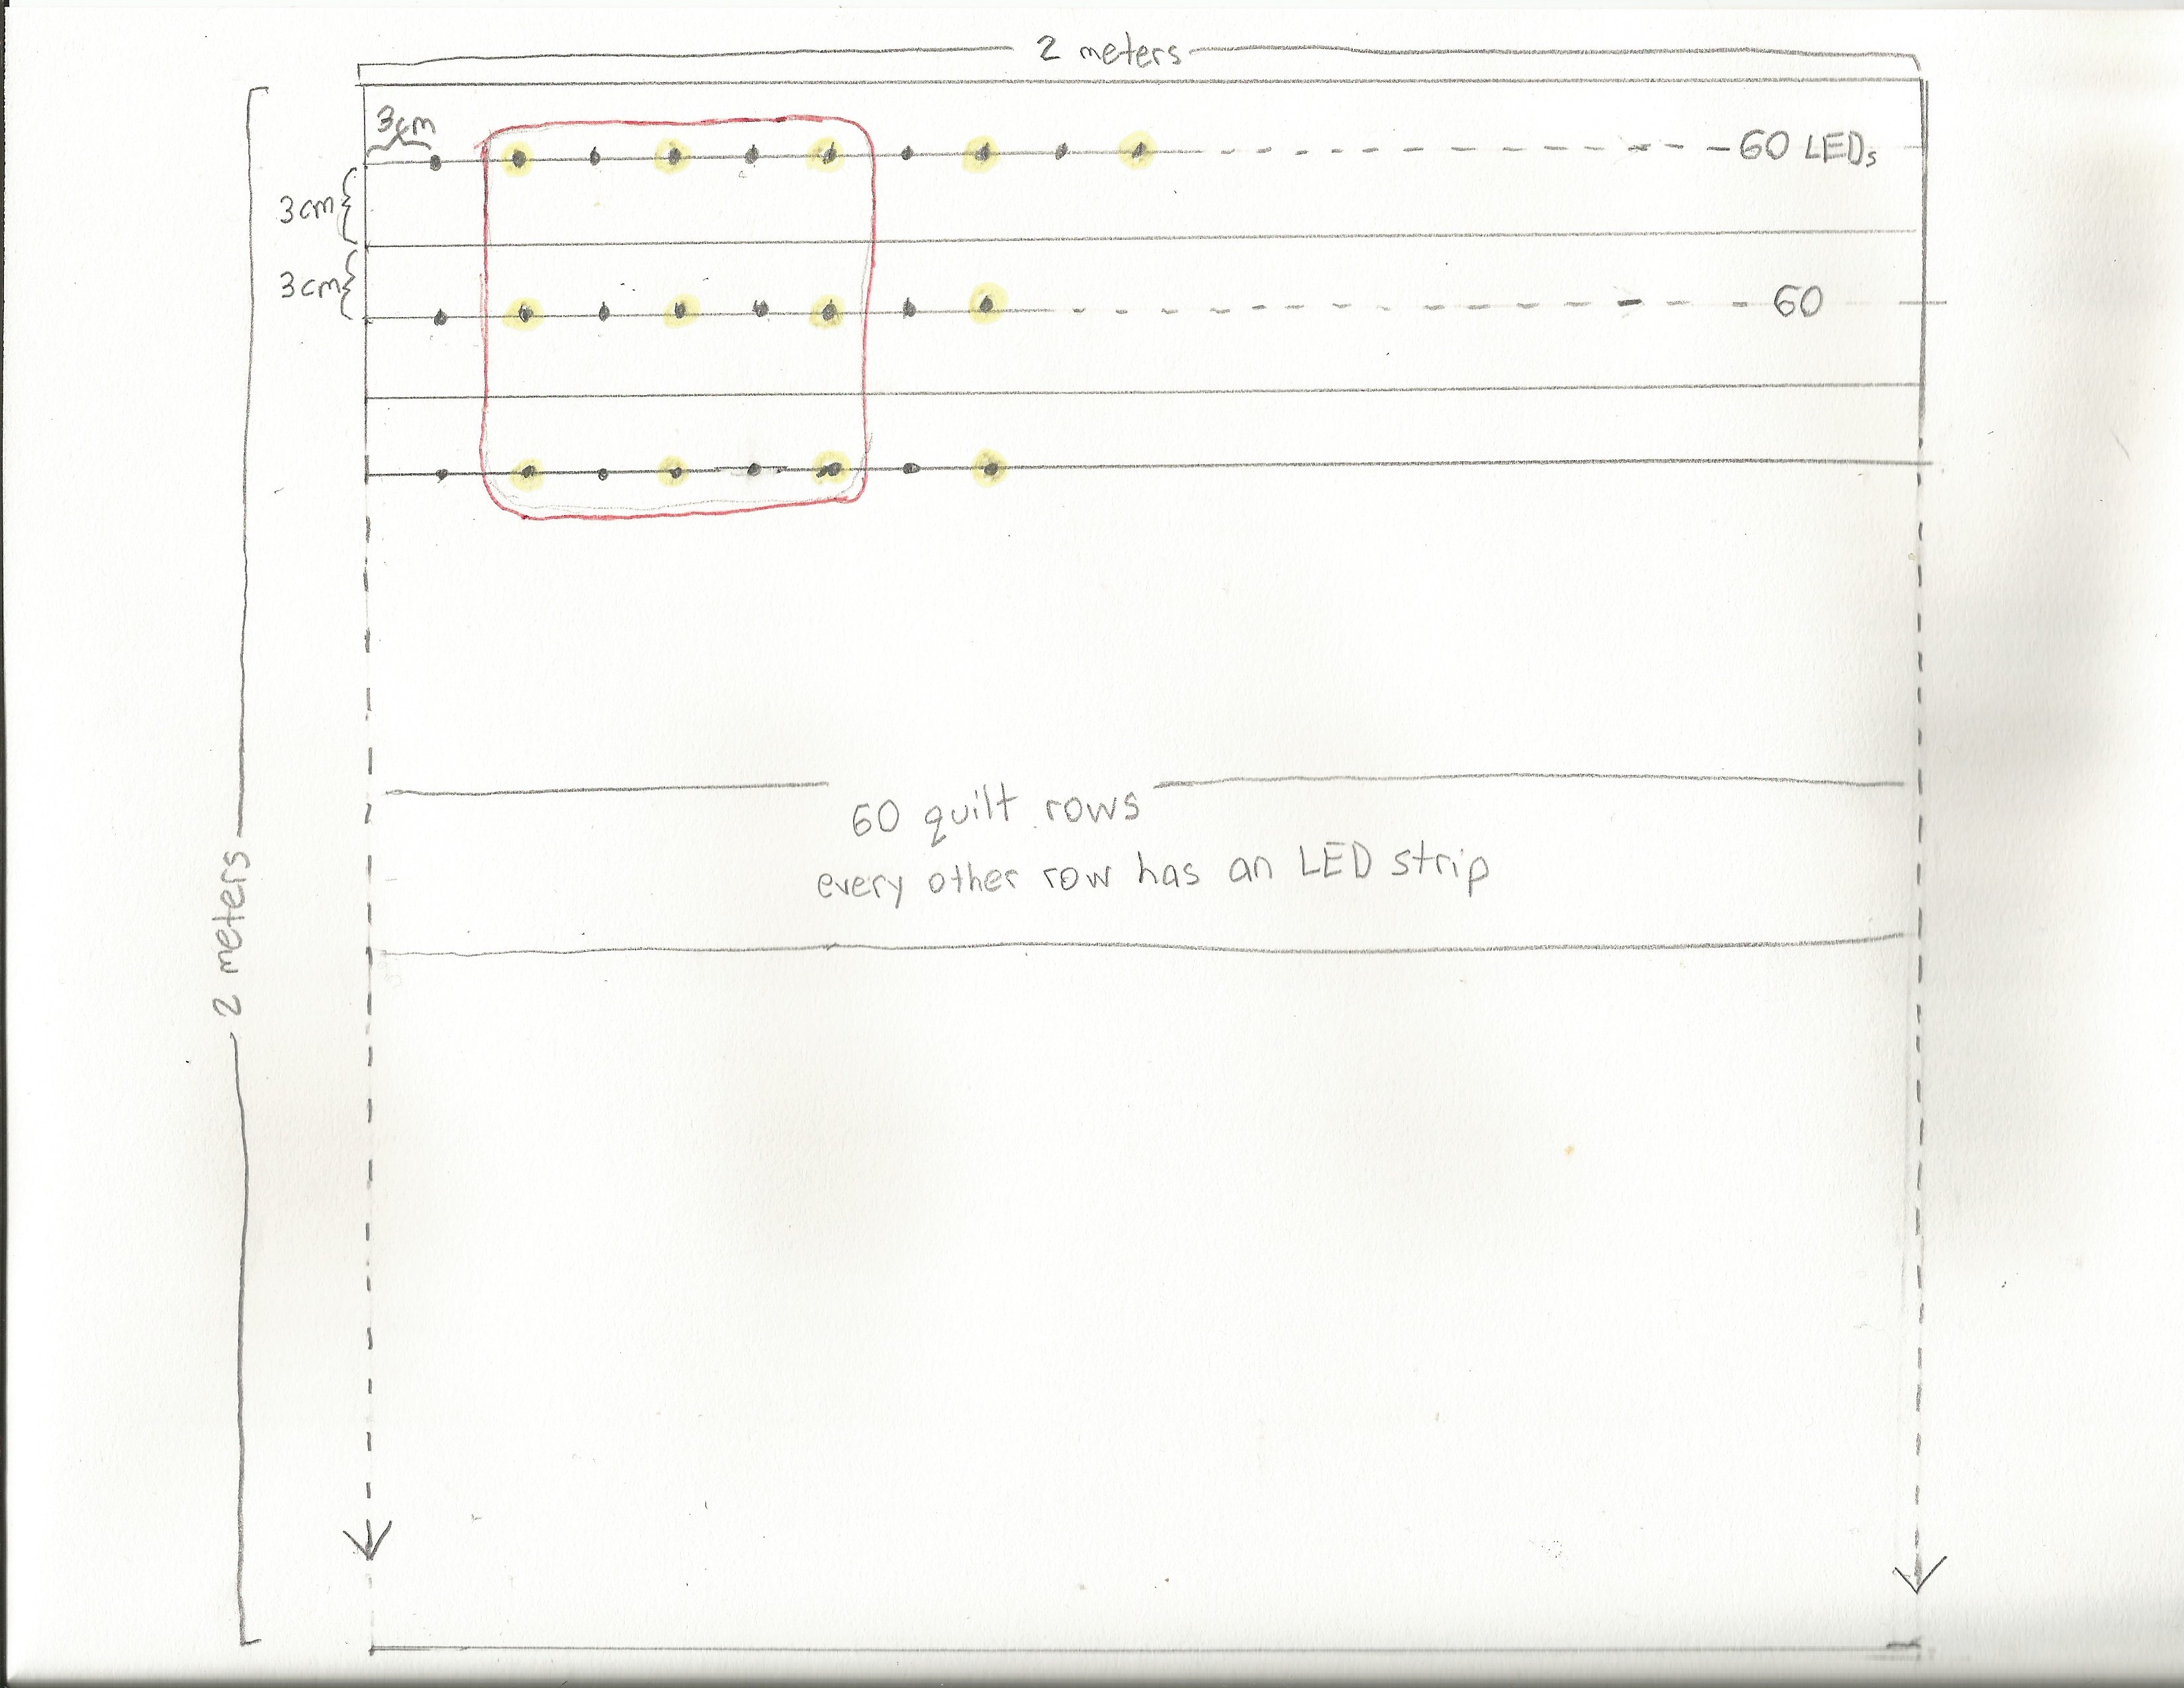
To light up our quilt, we purchased strips of digitally-addressable LEDs. There are 30 LEDs per meter which puts each LED 3 cm apart from its neighbors. Our quilt will be 2 square meters in size.
To save money, instead of purchasing 60 segments of 2-meter long strips, we purchased 30 segments of 2-meter long strips and will only light every other LED in order to keep an equal number of rows and columns. In order to maintain visual symmetry, we will place each row 6 cm apart vertically (because there will be a 6 cm distance between each lit LED on a given row). This whole layout gives us 100 3×3 grids of LEDs to represent the 9 event types per year in a century.
At this point, we are forgoing the ability to represent two countries with the same event type in the same year, as we do not have enough LEDs to form triangles.
Also to save on cost of materials, we are operating the color picker directly in the source code.
If you’re having trouble visualizing this, the sketch below details the 2mx2m quilt design. It depicts the 60×60 grid with only 30 LEDs lit across, and only 30 rows populated with strips. The LEDs that will be used are highlighted in yellow, and a sample year box is circled in red.
Additionally, leaving every other row empty allows for extendability in case we purchase more LED strips in the future. Simply slide them into the empty rows, and light all LEDs instead of every other one.
