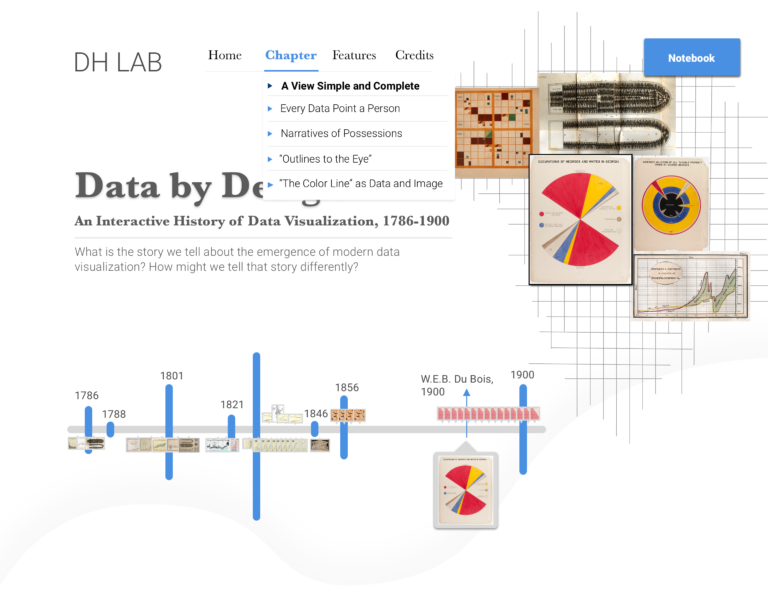
 Data by Design: An Interactive History of Data Visualization, 1786-1900, challenges the commonly-held belief that visualization serves as a neutral method for data’s display. In a series of five “data narratives” — chapter-length web-based texts that employ interactive visualizations in order to advance their claims — this project traces the rise of modern data visualization techniques. Feel free to check out the project site, where we post project updates. You can also explore our investigations of Elizabeth Palmer Peabody’s chronological grids and William Playfair’s time-series charts. We are currently adapting both of those projects into data narratives for Data by Design.
Project Contributors: Lauren Klein, Adam Hayward, Qing Tian, Jianing Fu, Dan Jutan.
You must be logged in to post a comment.